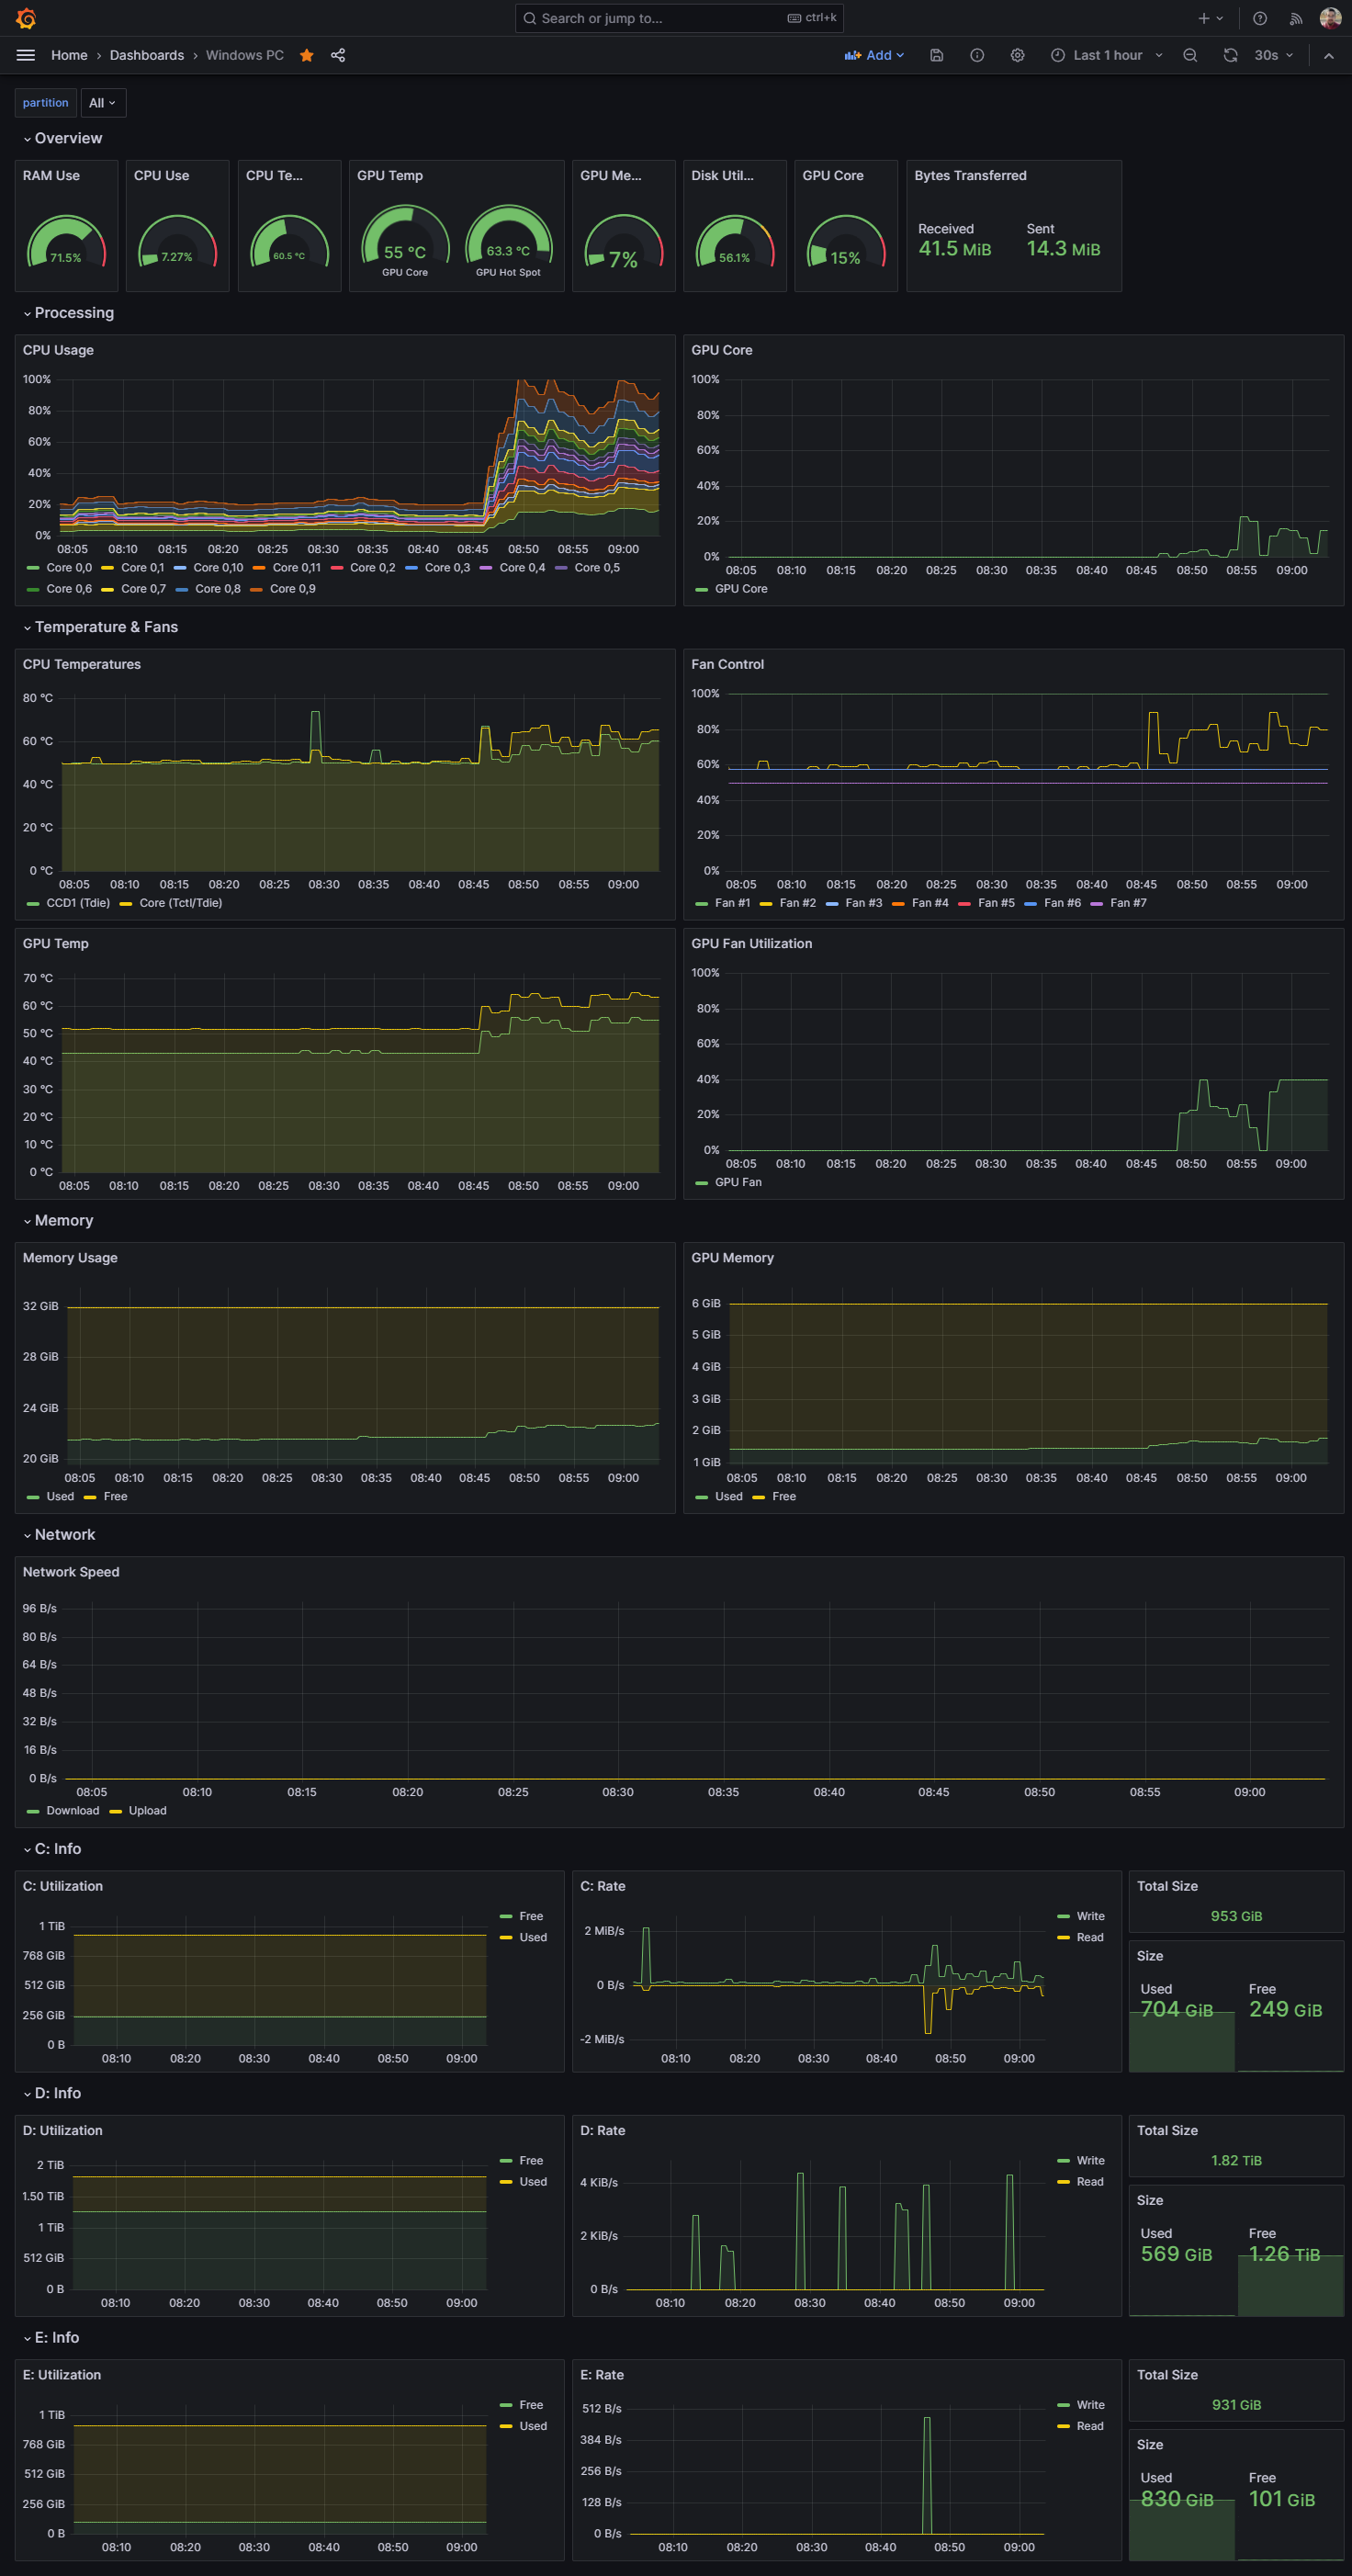
Home PC Monitoring
This is a simple project that that uploads metriics from my PC and Rasberry PI to my Grafana account.
Rasberry Pi Host
This will be the device that will collect the metrics of other devices in the network to upload them to Grafana.com.
I use the following docker-compose.yml file:
version: "3.8"

services:
  grafana-agent:
    image: grafana/agent:v0.32.0
    volumes:
      - /tmp/agent:/etc/agent
      - ./agent.yaml:/etc/agent-config/agent.yaml
      - /var/log/:/var/log/
    command: -config.file=/etc/agent-config/agent.yaml -config.expand-env
    env_file:
      - ./auth.env
    restart: always

  rpi-exporter:
    image: carlosedp/arm_exporter
    restart: always
Note
At the moment of writing this, 0.32.0 was the latest Docker image version that was compatible with armv7.
On that same directory, we need a auth.env file with the following:
These values are all obtained from your account in Grafana.com.
Additionally, we have the configuration file for the agent:
integrations:
  node_exporter:
    enabled: false
  prometheus_remote_write:
    - basic_auth:
        password: ${API_KEY}
        username: ${PROMETHEUS_USER}
      url: https://prometheus-us-central1.grafana.net/api/prom/push


metrics:
  configs:
    - name: integrations
      remote_write:
        - basic_auth:
            password: ${API_KEY}
            username: ${PROMETHEUS_USER}
          url: https://prometheus-us-central1.grafana.net/api/prom/push
      scrape_configs:
        - job_name: rpi-exporter
          static_configs:
            - targets:
              - rpi-exporter:9243
        - job_name: <job-name-for-pc-job>
          static_configs:
            - targets:
              - 192.168.1.1:4445 # OhmGraphite
              - 192.168.1.1:9182 # windows_exporter
Windows Devices
On Windows devices, I use two tools:
OhmGraphite
This collects hardware sensor data, such as CPU and GPU temperatures. I use it in Prometheus mode
windows_exporter
Collects general information from Windows machine, similar to node_exporter.
Raspberry Pi Devices
Configuration for additional Raspberry PI devices coming soon.
Grafana Dashboards
